 .
.
Science and Statistics: The "Null Ritual"
Marc Green
Torture the data and it will confess to anything. - Ronald Coase
I have a confession to make. It is a deep, dark secret that I've kept bottled up inside me for the past 48 years, but now it's time to confess. I never handed in my take-home graduate statistics final. I've been waiting (and sometimes hoping) for that midnight knock on the door followed by the academic police rushing into my house and informing me that my Ph. D. was being revoked. Yet, no one in our psychology department seemed to notice, then or now. More likely, no one cared. The hardcore Brown-Columbia school of experimental psychology dominated my department's culture. It had utter disdain for averaging across subjects and hence group statistics and especially statistical testing. In their view, research controls fall into two broad categories, experimental and statistical. We were indoctrinated with the view that experimental control is far more powerful and certain. The message was, "If your experiment needs statistics, then design a better experiment."
Naturally, all of this imprinted a strong distrust of statistical tests into my scientific DNA. This presents a problem because statistics is the oil that greases the machinery of much science. To see this, consider the question "What is science? It is the task of collecting data that say something meaningful about the real-world. The leaves open the question of determining which data are meaningful. The nearly universal method used to perform this task is "null hypothesis significance testing" (NHST), which Gigerenzer (2004) derisively terms the "null ritual." It is the gatekeeper that vets research for publication. Understanding how it works is central to understanding much of the scientific research literature.1
What is the "Null Ritual?"
In simplest form, the null ritual compares data from two populations, a control group and a test group (or two conditions with a single population). Depending on the question asked, the groups could differ in a variety of ways. The researcher theoretically starts with a hypothesis (H1), e.g., marijuana use while driving increases collision risk.2 The control group would not use marijuana while the test group would. An experiment might collect the data by testing drivers in a simulator while a data mining study might look at police reports of collisions to determine the marijuana use of the involved drivers. Either way, the researcher then performs a statistical test which is designed to prove the null hypothesis (H0) - there is no difference between the two groups (marijuana vs. no marijuana). The logic is: "If you're wrong, then I'm right." Rejection of H0 says that H1 is true. This logic is faulty. See below.
A problem usually arises because the scores for the test and control populations overlap to some degree. (Some drivers using marijuana don't have collision while some drivers who don't use marijuana do have collisions.) The researcher must decide if the difference between groups is meaningful. The group difference needed to reject H0 and accept H1 is a criterion "p-value" or "α" (alpha), the probability that the observed difference between test and control groups was due only to sampling variation. Almost all biology and psychology researchers use p≤0.5 to reject the null hypothesis, to conclude that their hypothesized effect (H1) is genuine and, more importantly, to deem it publishable. Of course, all of this presupposes that there was no confounding variable and that test and control subjects did not differ in any important way.
Criticisms of the "Null Ritual"
The null ritual has been criticized from many directions. Statistical nonsignificance at the p=0.05 level does not necessarily equal nonexistent. Some factor may correlate with fewer collisions but not be statistically significant, usually due to small sample size, small effect size, and/or large amounts of variability. Some (e.g., Hauer, 2004) have suggested that significance tests are detrimental to road safety because they cause effective safety measures to be dismissed. For example, a study (Johnson & Keltner, 1983) evaluated the relative safety of monocularly impaired and binocular drivers by examining their crash and traffic conviction rates. Although the monocular drivers had higher crash and conviction rates, the authors concluded that there was no difference between the two groups because the computed p-value for the difference was only 0.2. Slavish obedience to the null ritual might then miss an opportunity to increase safety by limiting monocular drivers.
The decision on whether to reject H0 (and accept H1) is an example of the Signal Detection problem. The experimental and control group's data are usually variable and overlap so the decision whether there is a genuine safety effect is not simple and categorical. This overlap means that errors are bound to occur. The researcher selects the decision criterion, the acceptable p-value, to balance between two types of error. One is rejecting the H0 when it is true (Type 1 error or "miss") and the other is accepting the H0 when it is false (Type 2 error or "false alarm"). The use of a 0.05 or any other "standard" level of p-value to determine significance is somewhat arbitrary and may dismiss effective safety measures by allowing too many Type 2 errors. In Signal Detection analysis, the probabilities and payoffs affect the criterion value that best optimizes utility in decision-making. When determining whether a variable affects an important payoff, such as reducing fatal collisions, payoff considerations might suggest that the required p-value criterion be relaxed to 0.08 or even higher. The result is fewer Type 2 errors and fewer missed safety improvements.
The arbitrariness of the p≤0.05 criterion highlights another problem with the null ritual; it imposes a forced dichotomization on to the data because the studied effect is either true of false. However, data provide graded, more-or-less support for a given hypothesis. In The Tyranny of the Discontinuous Mind, Dawkins explains how authorities clamoring for a definitive answer force scientists into providing somewhat arbitrary yes-no answers to complex problems. However, it seems that this is also what scientists themselves want and what the null ritual provides since it gives them a specific target to reach. The null ritual also likely also contributes to "publication bias." Studies failing to reach p=0.05 are seldom published. This means that the research literature contains mostly positive results which may be an optimistically distorted view of the evidence because negative results are never made public.
Some have attempted to address these problems. American Psychological Association (APA) journals now permit an intermediate solution to the p-value quandary. Authors may note results that are p=>0.05 and ≤0.10 because "Such trends describe the pattern of data that is suggestive but not statistically significant at the predefined α value" (Weaver & Delucia, 2020).3 These nonsignificant effects are likely to be relatively small, probably because other factors matter much more. Following Pascal, safety advocates pay attention only to Type 2 errors. But safety is never free. Increasing the criterion p-value could easily lead to promoting a multitude of safety initiatives which are useless or are too small to matter but which have high costs. Since safety policy is usually administered by "White Hats" (e.g., Cope & Allison, 2010), the costs of safety are typically down played or simply ignored. A more liberal (literally!) p-value criterion also begs the question of why bother with the research at all if pre-existing belief strongly biases the decision to employ a given safety measure. The controversy surrounding the DANMASK-19 study is a good example.
While failing the P≤0.05 significance test may cause dismissal of genuine safety effects, it is also true that passing the significance test can endorse trivial and meaningless differences. This is especially likely in studies with large numbers of subjects. There is a tendency to believe that if a study employed more subjects, then it must be more trustworthy. In fact, the opposite is often true. The sample population size per group (N) has a profound effect on the control-test difference needed to reach significance. With a big enough N, effects can reach significance but be trivial. If a study uses thousands of subjects it has more statistical power which is presumably a good thing. That's one viewpoint. Another is that if the study only reaches the p=0.05 significance level with many thousands of subjects, then the test-control difference is probably small. (And/or the variability is large.)
At the opposite extreme, some believe that the p=0.05 level is already too high because it overstates the evidence against H0 (e.g., Hubbard & Lindsay, 2008) making it a major factor in the "irreproducibility crisis" (Harris, 2017) that has infected biomedical and other sciences. Raising the p-value criterion or even following the APA's policy will only make matters worse and lead to even more unreliable research being published. Some (e.g., Benjamin, et al., 2018) propose lowering the required p-value from p=0.05 down to as low as p=0.005 if the finding is novel and/or unexpected.
Others suggest more conceptual reasons to distrust the null ritual. There have always been doubts about building a science based on statistical tests of the null hypothesis ever since it became de rigueur for publishable research in the 1940s and 1950s. Both readers and the researchers themselves often misinterpret what the tests are saying, e.g., believing that rejecting H0 provides support for H1. Many incorrectly believe that the null ritual provides p(H0|data), the probability of H0 given the data. It actually is a measure of p(data|H0), the probability of the data given the H0.
In addition, statistical tests are amenable to many types of manipulation that allow researchers to torture the data into significance. Studies with a large number of variables, for example, lend themselves to "p-hacking," making multiple comparisons on the same set of data without a statistical correction. The probability of obtaining at least one significant effect (Psig) rather than a nonsignificant effect (PNonsig) at the p≤0.05 level given N comparisons is:
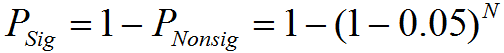
If N=1, then PSig is the standard 0.05. If N is two, then PSig is 0.10. As N increases, PSig continues to grow but at slower rate: at N=4 it is 0.19 and at N=14 the required PSig is 0.51, so there is an even money chance of obtaining a significant result. One solution is to reduce the required p-value for significance as N increases. The simplest approach is the Bonferroni correction of α/N. If one comparison requires a p≤0.05, then two comparisons require a p≤0.05/2 or p≤0.025. Researchers may only admit to one comparison in order to get a 0.05 result published. Although possible in experimental work, the lure of p-hacking is more likely to be baked into data mining, especially with large data sets, because there are opportunities to compare the effects of numerous independent variables on some outcome(s). Suppose that the original H1 is "Drivers on marijuana have more crashes" and that the test fails the null ritual. The researcher could do separate tests drivers who were older, younger, male, female, in small cars, SUVs, etc. Crashes could also be divided to create for new tests for fatal, nonfatal, at night, during the day, in cities, in rural areas, etc. The likelihood of some test producing a significant result grows with number of comparisons. The methods that can be used to manufacture significant results from dross data are almost endless. How could it be otherwise when the number of publishable results in high impact journals determines whether the researcher is a success or a failure. In science, as in all human activity, incentive structure controls behavior.
The null ritual's problems run so deep that some favor abandoning it altogether.5 A few journals have banned the null ritual from their pages and some areas of research, such my home fields of psychophysics and operant learning, rely on within-subject experimental controls that almost never employ significance tests. Others (McShane, Gal, Gelman, Robert, & Tackett, 2019) suggest demoting the null test from absolute authority to only one of many factors for vetting research. Research would then also be evaluated by factors such as consistency with prior evidence, plausibility of mechanism, study design, real-world costs and benefits, and novelty. Such highly subjective criteria are probably too vague to be workable. As Dawkins suggests, both researchers and nonexpert science consumers want a simple, "objective," clear-cut, dichotomization. (An old research motto is "They can't read, but they can count.") Many consumers of research, such as highway officials responsible for road safety, are simply not knowledgeable enough to evaluate the data and just want a yes-no answer.6
Despite its issues, the null ritual is nearly ubiquitous and deeply embedded in the road safety and other research literatures, and it isn't likely going anywhere soon. This presents a quandary when attempting to draw conclusions from the existing research literature. Although I have never used a statistical test in any published research,7 like everyone else I am forced to rely heavily on research that has been vetted by the null ritual. What to do?
While the null ritual is open to justifiable criticism, the faults may be less important than appear at first glance. Researcher decisions made before calculating the final p-value are likely more important than the p-value itself (e.g., Leek & Peng, 2015). These decisions include the study design, the subject sampling, the method used to summarize the data, the choice of statistical model and the selection of summary statistics. Further, a research study should be evaluated in the light of other findings.
Endnotes
1Like all psychology majors, I was taught NHST in undergraduate statistics class. It was just assumed that it would a basic component of your research.
2In some cases, however, H1 is not made explicit. Sometimes there is no hypothesis. Definitions of science often mistakenly include a bit about hypothesis testing. However, hypotheses are not necessary to conduct scientific research. Suppose I was designing a library and wanted to have a light level that was high enough to allow easy reading but not too high to use unnecessary electricity. I could test reading rate at different light levels to arrive at the optimal illumination. This is certainly science but there is no hypothesis. Or I could just measure visual acuity in dim light to determine the limits of human performance. Again, no hypothesis. Of course, someone else may use the results to generate or evaluate some hypothesis. The key feature of science is controlled observation, not hypothesis testing.
3This is really nothing new. In the past, authors finding that their p-value just missed the 0.05 cut off frequently said that "the data were trending in the right direction."
4The sweet spot for the ideal number subjects (N) is only 25-30. Starting at one, adding each additional subject (degree of freedom) lowers the effect size needed for significance. However, as the numbers increase, each new subject has a decreasing effect. For example, the new subject helps less when going from sixteen to seventeen than when going from ten to eleven. Further, the decrease in the benefit of adding subjects is nonlinear. After an N of 25-30, the contribution of each new subject declines sharply. Beyond this point, each additional subject contributes a small and decreasing influence on reaching significance. Since each additional subject adds to study's cost, adding subjects after 25-30 produces very little gain but greater cost. This makes 25-30 the optimal tradeoff between statistical benefit and expense. If a study requires more subjects than this, it is a signal that something is wrong, usually that the effect is very small and/or that poor controls resulted in great variability. If the study's outcome is relevant to millions of people, however, then a small effect may be important
5Some authors suggest substituting Bayesian statistical approaches (e.g., Goodman 1999). This is not a general solution because finding accurate base rates is in many cases difficult or even impossible. Moreover, the problems run even deeper in any statistical method that uses multiplication or division. To use these operations, the data must be ratio scale—they must be linear and have a true zero point. Few studies ever test the data to determine their metric property.
6The impatience of nonexpert research consumers with the ambiguities of science is discussed in 'Will Somebody Find Me A One-Handed Scientist?!' For experimental evidence on the pervasiveness of dichotomous thinking and its effect on interpreting health-related research, see Fisher, M., & Keil, F. C. (2018). The binary bias: A systematic distortion in the integration of information. Psychological Science, 29(11), 1846-1858.
7I once submitted for publication an experiment that had over 800,000 observations on three subjects (perception-response times of electrically brain stimulated rats). One reviewer was still upset that I hadn't done any statistical tests on the data.
A division of 2057949 Ontario, Inc.
Copyright © 2024 Marc Green, Ph. D.
Home Page
Contact Us


A division of 2057949 Ontario, Inc.
Copyright © 2024 Marc Green, Ph. D.
Home Page
Contact Us
![]()
![]()
![]()
![]()
![]()
![]()
![]()