 .
.
Death By Uber Part 2: The Tempe Police Department Report
Marc Green
Overview: The page discusses the Tempe Police Department’s (TPD) report on fatal crash involving an Uber‑operated self‑driving vehicle and pedestrian Elaine Herzberg. The report purports to determine factors such as sight distance and driver reaction time. Critical evaluation reveals that the report’s analysis is deeply flawed in many ways—the sight distance test was logically misguided and the estimated reaction time was based on a misunderstanding of research data. Moreover, the TPD erred in attempting to apply data for normal drivers to supervisors of self-driving vehicles. The report’s conclusion that the collision was avoidable by a "normal," “attentive” driver is unwarranted.
This second part focuses primarily on the TPD report's accident reconstruction which aimed to determine whether the collision
were avoidable. If it were, then Ms. Vasquez would be blamed and criminally charged. In law, a person can only be charged
for an avoidable accident. If it were unavoidable, then the person's actions are irrelevant, regardless of whether they reflect impairment by
alcohol, distraction, etc. because these factors did not affect the outcome. Lastly, this part also refers briefly to the NTSB
report to highlight where it diverges from the TPD accident reconstruction on the matter of sight distance.1
The TPD Accident Reconstruction
The TPD conducted a two-part analysis with the goal of determining the collision's avoidability. The first part was the empirical measurement of "sight distance," braking efficiency, and illuminance2. The second part was a theoretical analysis which modified the sight distance using several corrections and determined both an actual and an expected perception-response time (PRT). The study concluded that the collision was avoidable. I focus here on the determination of sight distance and PRT.
1. Sight Distance
a. Measurement
The study initially measured the sight distance of an exemplar pedestrian to an oncoming driver. Although not stated in the report, the method is usually called "first point of possible perception" (FPPP). The basic design placed a pedestrian on the roadway while a driver started far down the road after being told "to forget everything he had seen and heard about the collision." The vehicle approached at five mph, and the driver stopped when he saw the pedestrian. The distance from the front bumper of the vehicle to the pedestrian was recorded as the "sight distance."
The pedestrian was placed at two locations. The first was the edge of the travel lane which was 8.14 feet from point of impact.
This produced sight distances of 812.3 feet for a stationary pedestrian and 818.3 feet for a pedestrian walking in place.
The second location was one lane further left, so the pedestrian was 8.14+13.65=21.8 feet from the impact point.
The obtained sight distance was 637.3 feet. The TPD used this shorter distance in their subsequent analysis. Notice that placing the pedestrian farther left reduced the sight distance, which most likely due to the road's leftward curvature and possible obstructions from the overpass.
How fair was this test? Not very. To see why, first consider the question of where the Uber Volvo would be on the roadway when the pedestrian was at the test position, which was 21.8 feet from the point of impact. With a walking speed of 6.32 ft/sec, the pedestrian was 3.44 seconds from impact. At that moment, the Volvo Uber was not 673.3 feet away but rather only about 64.5*3.44=322.54 feet away.
Next, reverse the issue and consider where Ms. Herzberg would have been on the roadway when Ms. Vasquez was 673.3 feet from the collision.
The TTC for a vehicle 637.3 feet away from impact and traveling at 44.0 mph3 (64.5 ft/sec) is about 9.9 seconds.
Where was Ms. Herzberg at that moment? She wasn't where the TPD placed their test pedestrian.
Figure 2 in Part1 showed that even at a TTC of 5.6 seconds, Ms. Herzberg was much farther left than the test pedestrian.
The NTSB report's investigation found that the sight distance to a pedestrian at the 5.6 TTC location was only 350 feet, almost half the TPD value. As already explained the road's leftward curve and obstruction by the overpass support likely shortened the sight distance. Even then, the Uber Volvo would have been an additional 4.3 (9.9-5.6) seconds still farther away from the point of impact and significantly earlier than even the Uber Volvo sensors detected Ms. Herzberg. It is impossible to say with absolute certainty where Ms. Herzberg would have been prior to the 5.6 second detection point, but if she walked at a constant rate of 6.32 ft/sec, she would have been 62.6 feet from the impact point.4 This puts her off of the roadway and on the median where brush may have acted as a further partial obstruction. In sum, Ms. Herzberg was not near the location of the test pedestrian. She was much farther to an approaching vehicle's left where her sight distance would have been much shorter. The NTSB sight distance is a far more likely estimate. This disparity between TPD and NTSB report sight distances has significant knock-on consequences in the TPD attempts to adjust the artificial FPPP value to real-world conditions (see below).
Moreover, the NTSB report suggests that even a normally attentive driver might not have detected the pedestrian when the sightline cleared at 350 feet and cites supporting evidence:
[d]rivers do not typically scan outside a roadway's travel lane while negotiating a curve, even an attentive driver in the
Tempe crash scenario might not have detected the pedestrian when the ADS detected her (Shinar 1977; Kandil, Rotter, and Lappe 2010;
Itkonen, Pekkanen, and Lappi 2015). (p 43)
In sum, the TPD put the test pedestrian at the wrong place. Ms. Herzberg would not actually have been in the location used when the TPD recorded their 637.3 feet sight distance. At a 9.9 seconds TTC, she would have very likely been farther leftward, outside a clear sightline and likely off the roadway. It is impossible to say exactly what the sight distance would have been in a properly conducted test, but it would have been much shorter, possibly by about half, of the TPD value.
b. Sight Distance Adjustment
The TPD report next shortened sight distance, presumably to better represent real-world viewers. In the FPPP method used by both the TPD and the NTSB, the test driver knew that a pedestrian would appear and even knew when, where, and what how the pedestrian would appear. This knowledge gives the test driver a great advantage over a real driver, resulting in sight distances that are artificially inflated. (Test driver instructions to ignore what they know are futile.) It is commonplace to reduce the FPPP distance by employing corrections that reflect the difference between test drivers and real drivers in real conditions.
The TPD report attempted to correct for test driver cognitive advantages and also made some statistical corrections. The report followed methods suggested by Hyzer and Hyzer in a footnote found in Chapter 12 of the book Forensic Aspects of Driver Perception and Response (Olson, Dewar, & Farber, 2003). First, the report uses a 0.67 multiplication factor to "adjust the value to the expected mean value for drivers in a controlled study with a larger population," resulting in a sight distance of 426.99 ft. Next, they multiplied the distance by 0.5 to correct for the driver expectancy effect. Lastly, they corrected for the difference at which 85 percent of drivers5 "should be able to see and identify the pedestrian clearly" a reduction of 33 percent that resulted in a final distance of 143.04 ft. For a vehicle traveling 44 mph (64.5 ft/sec), this results in a TTC of 143.04/64.5=2.2 seconds.
If the TPD had used the 350 foot sight distance reported by the NTSB, then applying their corrections would result in a sight distance of 78.6 feet and a TTC of about 1.25 seconds. As already noted, however, the NTSB says that even a 350 foot starting point for sight distance may be optimistic.
The TPD sight distance method is highly questionable. Apart from the clear invalidity of the 637.3 foot sight distance, TPD performed their corrections in cookbook fashion. There is nothing in the footnote to show the basis for the method, how it was developed, what its limitations might be, etc. The TPD have no way of evaluating whether the method is accurate or not since they do not know how the authors arrived at it. When relying on research to draw conclusions about a collision (or anything else) it is critical to use data from research situations which closely resemble the one being investigated. The situations used to derive the corrections are unknown, so the validity of the method for this collision is unknown.
Their application of the 0.5 expectancy multiplier illustrates the problems of relying on cookbook methods without any real understanding of their bases. The 0.5 expectancy factor doubtless originates from the well-known Roper & Howard (1938) study which tested drivers with an initially unexpected pedestrian and then later with expected ones. In the unexpected conditions, the drivers responded to the pedestrians with a much shorter sight distance, roughly half the distance (actually 51 percent) of the expected ones. However, the research conditions differed in from the present case in important ways. The Roper & Howard (1938) "pedestrian" was a dummy that was located straight ahead in the driver's travel lane where it would ordinarily be directly in the sightline. Ms. Herzberg approached laterally from the left outside a direct sightline down the road. Unlike the Roper & Howard (1938) conditions, her collision was also a CBDR scenario that produces lower detection. (See this page and Green, 2024), and the discussion below.)
Moreover, it is often overlooked that the Roper & Howard (1938) halving of sight distance applied only to the mean driver. The 85th percentile driver in the unexpected condition detected the pedestrian at only 40 percent of the expected ones. The TPD report apparently attempted to analyze distance for the drivers below the mean but still within normal variability: they used the 85th percentile for the distance where they "should be able to see and identify the pedestrian clearly." For consistency, the Roper & Howard (1938) multiplier would logically have been 40 percent and not 50 percent. The final TPD distance would then be 114.4 feet and TTC would be 1.8 seconds. Starting with NTSB's optimistic 350 feet, the final corrected sight distance would be 62.8 feet with a TTC of 0.98 second.
This discussion highlights the problem of investigators such as the TPD who perform analyses using secondary sources in cookbook fashion. They have not read the source research directly to learn the research's methodology and limitations, i.e., how and when to apply it. The research world and the real-world are not identical and research results seldom, if ever, transfer directly from contrived research studies to natural, real-world behavior.
Lastly, the most obvious flaw in there visibility distance assessment, and one that pervades their entire report is that all of the corrections applied by the TPD report originated from studies (such as Roper & Howard, 1938, of drivers in conventional vehicles. When discussing expectation, they do not allow for the fact that Ms. Vasquez would normally have expected the ADS to issue a TOR if there were some issue ahead. Moreover, there is much research suggesting that supervisors of level 3 and even lower levels of automation exhibit performance decrements compared to conventional vehicle drivers. This is discussed at length in Part 3.
2. Perception-response time (PRT)
Having concluded that a driver had 2.2 seconds to avoid the collision, the TPD next determined whether a driver could respond within this time. They concluded that the answer was "yes," but again their methodology and reasoning were faulty
PRT is an interval bounded by two events, a clock-starter, the moment when a person perceives the need to respond and a clock-stopper, the moment that a person initiates response. Determining these starting and stopping points is the key task in determining PRT. The TPD used two types of analysis, actual based on data from the collision, and expected, based on a scholarly source.
The TPD concluded that Ms. Vasquez's PRT was 0.50 second. The clock starter was "the very first frame where the driver's eyes are open and focused above the level of the dashboard." This is not a measure of perception, which is when the viewer consciously perceives. The clock stopper was the time that Ms. Vasquez's image blurs, indicating that impact had occurred." This is a rather bizarre clock-stopper since Ms. Vasquez had initiated no motor response. Moreover, PRT depends on urgency, so a PRT at TTC of 2.2 will be longer than a PRT at TTC=0.2. For example, Jurecki (2016) measured PRT using drivers who were prepared to stop to an object suddenly appearing straight ahead. PRT doubled when TTC went from 0.5 to 2.0 seconds.
The TPD report also determined an expected PRT, saying that "The text suggests that the range to use in this case, where expectancy was already accounted for by the 0.5 multiplier above, could be between 0.6 and 1.25." (Presumably the "text" was again Olson, Dewar, & Farber 2003). This also seems to suggest that there was enough time for a driver to avoid a collision with a 2.2 seconds TTC.
Of course, this conclusion was based on the TBD's faulty sight distance test. Recall that an analysis using the NTSB sight distance gives the driver a 0.98 second TTC to respond. Taking the TPD analysis at face value, some normal drivers would fail to avoid because the expected PRT ranges as high as 1.25 seconds.
Note also that PRT refers only to the time required to initiate response and not the time to perform the response. There is a delay from the time that the driver touches the brake (no braking) to fully depressing the brake pedal (maximum braking), a period that was once called the "preskid" interval (before antilock brakes). The TPD braking data show this delay. It is fairly small but then the driver was prepared to brake and was a police officer who presumably had some specialized training in vehicle handling. Still, the TPD do not take this preskid delay into account at all.
Perhaps more importantly, the TPD remarks reflect a misreading of what the "text," says. Olson, Dewar, & Farber (2010) suggests that the 0.6-1.25 seconds PRT should start only after the detection has occurred:
For example, investigation of nighttime collision with a pedestrian, the defendant driver may testify that that he suddenly
saw the pedestrian in front of his car and slammed on the brakes. The testimony suggests no problems in either identification
or decision, so except for the detection interval, the situation is straightforward. Since there are no data on the
length of the detection interval, some guesswork is involved. If the target object is in front of the vehicle or nearly so
and is relatively large, as in the case of a pedestrian, and the driver was looking forward, it is probable that the detection
interval would be very short. In such a case, the balance of the PRT is probably in the range of 0.6 to 1.25 seconds. [emphasis mine]
Olson, Dewer & Farber (2010) are saying that the 0.6-1.25 only applies when "the target object is in front of the vehicle or
nearly so and is relatively large." This is consistent with the NTSB statement above that drivers do not typically scan outside
a roadway's travel lane. Further notice that the 0.6-1.25 time is the "balance" after whatever time is required for detection, so
the total PRT can be longer. Objects detected in the peripheral field project images in less sensitive portions of the retina
outside the center of focal attention. When such objects are detected, viewers automatically make a saccadic
eye movement toward the object. Saccades have their own "PRT" of at least 0.20 second and
there is small amount time required to actually turn the eye. If the saccade misses the target,
further small saccades may be required to achieve fixation. Moreover, if the object is much closer that the current viewing distance,
then another 0.20 seconds is required for accommodation (e.g., Travis, 1948). By itself, eye movement considerations would add
about 0.25-0.30 second to the PRT for peripheral objects (Green, 2000). This value does not include the detection time.
So when does the laterally approaching pedestrian appear in front of the vehicle? I have already discussed this
in another article and more extensively in Green (2024).
To summarize, Figure 3 shows that the approaching pedestrian is only in front of the vehicle just prior to collision.
At longer TTCs, the pedestrian remains at a roughly constant bearing angle, which creates little retinal slip and low conspicuity.
However, the driver's eye would be about 7.8 feet from the Uber Volvo's front bumper (according to my measurements),
so the eccentricity falls closer to the moment of impact. The important point is that the eccentricity remains roughly constant
creating a CBDR scenario (as described elsewhere and Green (2024)) until only 0.5-0.75 second prior to impact.
This is when the pedestrian is close to the front of the vehicle and in the driver's sight line.
In sum, Figure 3 shows why laterally approaching pedestrians go from invisible to highly visible in the blink of an eye.
Note that the relationships depicted in Figure 3 are the result of simple physics: the geometric, optical, and photometrics inherent in the situation.
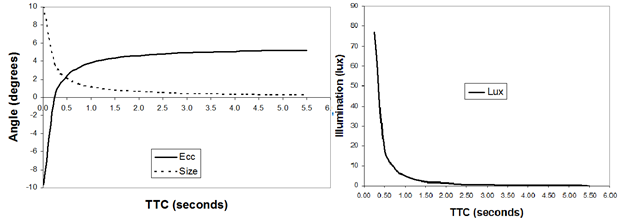
Figure 3 Changes in viewing conditions as function of TTC. Left: the solid line change retinal eccentricity
and the dash line is change in visual angle (size). The negative angle means that the pedestrian has crossed the driver's sightline
to the right.
Further, location is not the only visual factor that changes dramatically in the last second. Olson, Dewer & Farber (2010) also say that the image must be large. Figure 3 also shows how image size explodes from very small to very large in the last 0.5-0.75 second-the well-known looming phenomenon. This makes the pedestrian highly conspicuous only at the last moment. Moreover, the effect of headlamp illumination shows a similar trend in the right side of Figure 3. Headlamp illumination is minimal and grows only during the last second due to the Inverse Square Law. Since headlamps point rightward and Ms. Herzberg approached from the left, however, she was out of the strongest part of the beam.6 At the last moment, however, she would be so close to the vehicle illumination would be strong.
Another factor also comes into play just prior to impact. Visual attention is 3-D, meaning that it is allocated not just up/down and left/right, but also near/far. A driver looking down the road has his attention allocated to the distance, so he will not readily notice objects near the vehicle. Yet this is exactly where the pedestrian is located in the last momenents prior to collision.
In sum, during the last 0.5 to 0.75 seconds a pedestrian goes from small in size, dimly lit, outside the sightline and the focus
of attention to appearing dramatically in front of the vehicle large and brightly lit. All of these factors contribute to
the common phenomenon that a pedestrian walking on a lateral collision course with the front of a vehicle seemingly goes from
invisible to suddenly very obvious just prior to collision. This definition of the clock starter meets the
Olson, Dewer & Farber (2010) criterion. The final conclusion is that many, and possibly most, normal drivers in a 0.6-1.25
second PRT range will find the collision unavoidable.
When confronted with the issue of expectancy some attorneys will counter with the question such as: "Shouldn't a prudent
driver always be alert to the possibility that some emergency will occur?" The simple answer is "yes,"
but the matter is a tad more complex than that. It is fair to say that a prudent driver should recognize the possibility
some emergency situation may develop at any time. On the other hand, experience teaches us that other drivers will virtually
always respect STOP signs and traffic signals...Pedestrians will cooperate in this endeavor as well and not place themselves
in the path of a car when the latter clearly has the right of way... It is generally safe to assume that, however,
that rational persons will not deliberately jeopardize their personal well-being or risk damage to their vehicle.
Traffic would indeed be chaotic if the drivers had to operate their vehicle in a way that would prepare them
to respond to the possibility, however remote, that [sic] any vehicle or pedestrian may violate their right of way at any time.
So what would be a reasonable estimate for the total PRT given the circumstances that night? This is a difficult and perhaps irrelevant question (Green, 2024). The entire idea that PRT can be precisely specified is questionable, especially given the disruptive emotional effects of suddenly seeing the looming pedestrian directly in front of a vehicle. I have quoted Olson, Dewer & Farber (2010) extensively because the TPD relied on it to apply their cookbook analysis without understanding the larger picture. So I'll close with some quotes from one of the book's authors (Paul Olson) about trying to determine an exact PRT.
"However, any attempt to produce hard estimates of perception-response time for a situation that has some complicating features is fraught with peril. (Olson, 1989)
It is, of course, the height of absurdity to apply 20/20 hindsight to a situation in which a driver must make a quick decision under life-threatening circumstances. (Olson, 1996)
This, of course, exactly what the TPD did.
Lastly, Olson's second quote hints at another oft-overlooked issue in trying to determine PRT. Engineers, etc. have a strong tendency to view humans as machines. Human "failure" usually is viewed in the same light as a machine component fault, a deviation from the proscribed performance (Leverson, 2016). However, humans are not (just) machines. When facing a sudden, unexpected emergency, they experience a strong emotional response that can impair behavior (e.g., Thackray and Touchstone, 1983; Dilich, Kopernik, & Goebelbecker, 2002). It may seem that in a vehicle-pedestrian conflict, only the pedestrian has something to fear. This is not true because the sudden appearance of a large bright looming object that is rapidly approaching a driver is automatically perceived as a threat that evokes a strong innate fear response. The sudden appearance of a large, bright pedestrian seemingly coming from nowhere creates a shock that jolts the driver from one mental mode to another. Humans have two modes of behavior, which authors have distinguished by various names, System 1 vs. system 2 (Kahneman, 2011), focal vs. ambient (Norman, 2002), controlled vs. automatic (Schneider & Schiffrin, 1977), etc. Driving is largely an automatic (ambient/System 1) behavior that occurs with little or no conscious thought based on well-established schemata, organized memory structures that set expectations and guide fluent behavior. The sudden violation of the schemata disrupts behavior and jolts the driver into the controlled mode (focal/System 2) mode resulting in shock and behavioral disruption (Kay, 1971).
Conclusion
The term "avoidable" has two quite different meanings. One refers to whether collision avoidance would be in the realm of possible human behavior. For example, a driver may have made a fortuitous eye movement leftward and have seen Ms. Herzberg early enough to avoid the collision. This is certainly possible human behavior. However, given what the NTSB said about where drivers look as well as research data (Mourant & Rockwell, 1972) showing a rightward bias in driver eye movements, it is possible but unlikely that a driver will look leftward (unless coming to an intersection, driveway, etc.).
If the TPD were merely saying that avoidance were possible, then I would agree. However, I doubt that this what the TPD report is saying. It is saying that Ms. Vasquez is blameworthy because she failed to avoid a collision that would have been avoided by what the NTSB terms an "attentive" driver. Avoidance was not just possible; it was probable if the driver were behaving properly.
As I have explained above, the report's analysis of sight distance and PRT are deeply flawed.
The TPD report based its conclusion on their sight distance measurement, sight distance corrections, and application of the 0.5-1.25
seconds PRT. First, even accepting their 0.5-1.25 value, the more realistic NTSB sight distance measurement suggests that some normal
drivers would not avoid the collision. However, Olson, Dewer & Farber (2010) note that 0.5-1.25 seconds represents the balance after
some ill-defined detection interval. The actual PRT could be then be longer. Second, the TPD failed to add the preskid interval to
the PRT, which would then slightly inflate the amount of time and distance required for avoidance and increase the number of drivers
who would fail to avoid. Third, the TPD misunderstood what Olson, Dewer & Farber (2010) were saying about PRT. The 0.5-1.25 second
PRT applies only after an ill-defined detection interval when the pedestrian is near the vehicle's front. This normally occurs within
the last 0.5 to 0.75 seconds prior to impact. As a result, many, if not most, normal drivers will fail to avoid the collision,
even if they are looking ahead down the roadway. Lastly, it must be understood that attempts to create theoretical expected values
of it is variables such as PRT are, to use Olson's words, "fraught with peril" because "since there are no data on the length
of the detection interval some guesswork is involved."
The main problem is to determine when to start the PRT clock running.
For example, the Comprehensive Human Factors Guidelines for Road Systems (Lerner, Llaneras, Smiley, & Hanscom, 2005)
says "PRT does not start until drivers can see and, to some degree, recognize the hazard." To some degree?!
The vagueness of the guideline illustrates the difficulty of determining the PRT with much precision.
There is one final glaring flaw with the TPD report. The detection period preceding the 0.5-1.25 second PRT depends on
many factors including that state of the driver. Many studies have shown that drivers who repeatedly travel the
same route lose awareness and fail to notice relevant road information (see next section.) Moreover, the
TPD fails to take into account the strong evidence that the passive monitoring of a reliable ADS in
self-driving vehicles will cause normal humans to exhibit performance losses in visual functions such as vigilance
and PRT. The next part examines these effects of ADS monitoring on supervisor behavior and considers how they would
affect the probability of avoidance even when the eyes are on the road.
Endnotes
1My analysis of the collision used some approximations and simplifications, many noted here and in Part 1. Some may quibble a bit with them but changing them much does not affect any of my conclusions. In fact, one of the messages here is that determining factors such as visibility and perception-response time is difficult and cannot be done in cookbook fashion. As a wise man said, "Exact science is not an exact science."
2The lighting didn't feature prominently in either report beyond the conclusion that there was enough light for visibility. The TPD had light measurements performed on the roadway. Most areas showed an illumination of about 7-10 lux near the roadway surface. The NTSB also made casual subjective lighting observations. Both the TPD and NTSB concluded that the lighting level was sufficient to make Ms. Herzberg visible. This was probably true in the sense that a prepared viewer who knew where to look and had her in the sightline would have seen her. Some research (Bhagavathula, Gibbons, & Kassing, 2021) suggests 10 lux at face level for marked midblock crosswalks, although some propose 20 lux (e.g., Gibbons, Edwards, Williams, & Andersen, 2008) or even 40 lux (Hasson, Lutkevich, Ananthanarayanan, Watson, & Knoblauch, 2002). However, there are several issues with the TPD and NTSB conclusions. First, I have explained elsewhere why illuminance is an unreliable metric because visibility depends on contrast and not directly on illuminance. In the real-world objects must be well above contrast threshold for detection. Second, the NTSB observations were analogous to the FPPP method-they cannot be taken at face value because the observers knew where to look. Third, the TPD measurements were near the roadway and not at face level where light is usually measured. Headlamps aim down so measuring at the roadway exaggerates light level. Fourth, there is more to perception than visibility. Viewers often fail to perceive even highly visible objects when, for example, they are unexpected like a pedestrian crossing outside a crosswalk in the middle of a roadway. The 10 lux level assumes that there is a crosswalk to alert drivers to the possibility of a pedestrian crossing. At the unmarked location Ms. Herzberg crossed, 10 lux is probably too low an illuminance level to ensure detection. Higher illuminance would be needed to create conspicuity. Lastly, Ms. Herzberg approached from the left, but headlamps aim rightward, so she was never in the main portion of the Uber Volvo's headlamp beam. In sum, Ms. Herzberg was likely visible in the strictest sense, but it is not clear that she was conspicuous enough to overcome driver expectation and low visibility conditions.
3The Uber Volvo speed varied slightly in the time leading up to the collision. It accelerated to 44.3 mph at the TTC of 5.6 seconds and then traveled between 44.6 and 44.8 mph until TTC was 2.5 seconds when it slowly decelerated from 43.8 to 40.5 mph just before collision. In most places, I assume a nominal constant speed of 44.0 mph (64.5 ft/sec). Moderate changes to this nominal speed does not affect any of my conclusions.
4The TPD claimed that Ms. Herzberg's walking speed in the last second before collision was 4.67 ft/sec, a value that they then generalized to characterize her average speed. Figure 2 shows that this cannot be correct.
5The 85th percentile is a standard value used to denote the upper limit of normality. In the transportation industry, it is understood that road users are variable. Instead of requiring behavior of the 50th percentile mean user, leeway is always added to cover normal variability in the population. In most cases, normal variability extends up to the 85th percentile user.
6This graph is based on archival data (Shoettle, 2001) showing halogen beam intensity straight ahead of the vehicle. The exact values vary somewhat with the type of headlamp beam, but the general shape of the curve is always the same since the Inverse Square Law is always in effect. In fact, changing vehicle and pedestrian speed or headlamp type has remarkably little effect on any of the curves in Figure 3.
Next: Death By Uber Part 3: "Automation Complacency" Impairs Drivers."
A division of 2057949 Ontario, Inc.
Copyright © 2024 Marc Green, Ph. D.
Home Page
Contact Us


It is, of course, the height of absurdity to apply 20/20 hindsight to a situation in which a driver must make a quick decision under life-threatening circumstances. (Olson, 1996)
A division of 2057949 Ontario, Inc.
Copyright © 2024 Marc Green, Ph. D.
Home Page
Contact Us
![]()
![]()
![]()
![]()
![]()
![]()
![]()