 .
.
Rear-End Collisions
Marc Green
| Updated 7 Aug 2025 |
Overview: To understand the causes of rear-end collisions, and all other accidents, the first step is to determine how a person normally and successfully performs the task. The second step is to determine why the person failed to perform the task successfully in the particular situation. This article explains how people normally use optical information in the avoidance of rear-end collisions. In particular, I examine the role of looming in vehicle guidance. Like perception-reaction time, the concept is far too frequently used by "experts" with no understanding of the underlying science, "ecological optics." Moreover, there is much more to collision avoidance than simple looming detection. Rear-end collision avoidance at high speed is a three stage process.
The key perceptual issue in most rear-end collisions is motion perception rather than visibility. In daylight, the lead vehicle is usually visible. At night, there may be instances where the lead vehicle is dark or difficult to see. Generally, however, taillights and sometimes reflective tape make the lead vehicle visible, if not necessarily recognizable, at a relatively long distance.
Drivers see many vehicles on the roadway ahead, so the mere presence of a lead vehicle does not necessarily imply the need to respond. They can use spatial cues such as headway to determine the sign of relative motion, i.e., whether they are closing, falling farther behind or staying a constant distance. However, they cannot tell anything about the rate of closing or the imminence of collision. This is not a problem in normal driving, since the closing speeds are relatively low. If the vehicle ahead is unexpected stopped or very slow, then the situation changes because closing rate is fast, and the crude spatial information is no longer adequate. The drivers must determine that they are rapidly closing on a lead vehicle and that the time-to-collision (TTC) is short. This requires a different type of visual information, optical information which is contained in the retinal image transformations that occur with movement through the environment. For collision avoidance, the most important information is contained in the retinal image dilation of approaching objects, a perceptual phenomenon called "looming motion."
The analysis of driver looming/motion perception and behavior consists of two sets of factors, sensory and cognitive. The sensory, "psychophysical" factors are the eye's ability to sense object contrast, motion, etc. These limitations are hard-wired into our species. Sensory factors bound what is humanly possible. That is obviously a good place to start a collision analysis.
The sensory information by itself, however, has little significance. To behave intelligently, drivers must interpret the sensory information, and assess the situation. This requires cognitive processing that is largely based on experience and expectation. Lastly, there is much more to collision avoidance than just perception. The decision on whether, when, and how to respond depends on the available response alternatives and their consequences.
This article provides a bare-bones introduction to the psychophysical aspects of collision avoidance. Psychophysics is the discipline that relates the physical world to the psychological world. Physics here is the description of the optical events, the image projection on to the retina, that occur when a driver closes on a lead vehicle. The psychological world is the driver's motion detection ability. The outline presented below is just the tip-of-the-iceberg of the entire perceptual psychology field of "ecological optics" (e .g., Gibson, 1979), which is critical for understanding visually guided behavior such as driving. Finally, I briefly touch on some cognitive and response factors, but these are discussed more fully elsewhere (Green, 2024).
Sensory Analysis
The optical transformation that the visual image undergoes as the driver travels forward is the primary sensory information that drivers use to judge whether a rear-end collision is imminent. When a driver views an object such as a truck (Figure 1), it creates an image on the eye's "film," a light sensitive layer called the "retina." As the driver approaches the truck, the retinal image expands, and the edges move outward. Figure 1 shows an object's image at time T and then the same image a moment later (time T+1) as the driver nears. On the retina, the truck's edges have moved outward, creating a motion cue called "looming." The faster the closing rate, the faster the expansion, the faster the edge motion and the greater the looming.
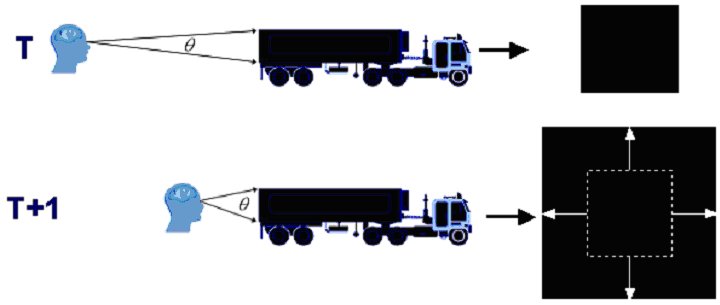
Figure 1 Schematic depiction of retinal image expansion and of looming.
It is possible to use optical expansion rate, combined with the instantaneous image size, to perceive the time-to-collision (TTC), signified by the variable 𝜏 (tau)1:

where
𝜏= time-to-collision (seconds)
θ= retinal image size (radians)
dθ/dt= expansion rate of retinal image growth (radians/second)
This relationship between image growth and TTC was first noted by Astronomer Fred Hoyle in his 1957 book The Black Cloud and subsequently rediscovered by Weinberger (1971). However, Lee (1976) first appreciated its relevance to driver behavior. According to the "𝜏 hypothesis," (Lee, 1976) a driver can use this retinal image growth for collision avoidance by directly perceiving the time-to-collision. To see this, just take any object, hold it at a distance and move it toward your eye. The image grows until it fills the entire visual field as it strikes the eye.
There is no doubt that the calculation (size)/(expansion rate) empirically gives the TTC. The role that this information plays in collision avoidance, however, is still debated, and I shall return to the issue later. However, there is no dispute on one point: when an object is distant, the expansion rate dθ/dt is so slow that the driver cannot detect the motion and could not use this looming cue or any similar optical variable to perceive closure. As the driver approaches the lead vehicle, the expansion rate increases until it reaches motion detection threshold. At this point, there is theoretically sufficient sensory information to precisely determine the TTC. (The driver can also use an optical variable,
This critical point requires some explanation. Thinking in terms of optical variables is unintuitive to most people, so it is often better to express them as their spatiotemporal equivalents. Figure 2 shows the conversions:
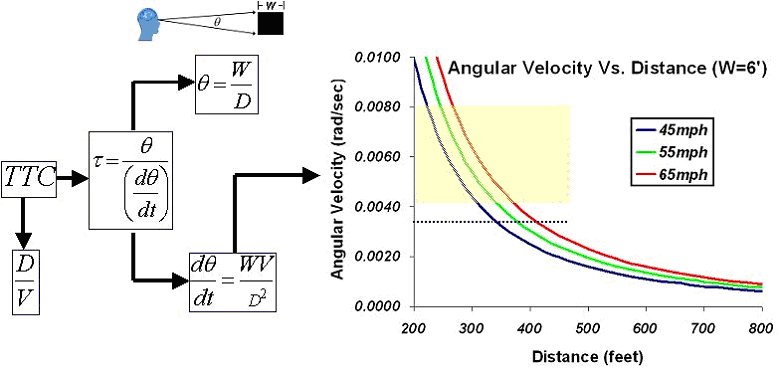
Figure 2 Comparison of TTC from spatiotemporal variables and tau from optical variables. The graph shows the effects of closing velocity and distance. The dashed line is the mean looming threshold found in research studies. The yellow area is the best estimate for real driver looming thresholds.
TTC is simply distance/velocity (D/V) and using the small angle approximation, the retinal image angle is size/distance (W/D). Table 1 demonstrates that TTC calculated by spatiotemporal and by optical variables produces the same result. According to Gibson (1979), however, drivers cannot use the spatiotemporal variables because they are "extrinsic," not represented directly in the visual array while optical variables are "intrinsic." This presumably explains why drivers are so poor at estimating distance and speed—they do not actually use such variables to guide their vehicles.
Table 1 TTC calculated by spatial and optical variables.
| Distance (feet) | Velocity (feet/sec) | Width (feet) | Vis Angel (radians) | Ang Vel (dθ/dt) | TTC (Dist/Vel) | Tau (θ/dθdt) |
|---|---|---|---|---|---|---|
| 50 | 80.8 | 6 | 0.1194 | 0.1939 | 0.62 | 0.62 |
| 100 | 80.8 | 6 | 0.0599 | 0.0485 | 1.24 | 1.24 |
| 150 | 80.8 | 6 | 0.0400 | 0.0215 | 1.86 | 1.86 |
| 200 | 80.8 | 6 | 0.0300 | 0.0121 | 2.48 | 2.47 |
| 250 | 80.8 | 6 | 0.0240 | 0.0078 | 3.09 | 3.09 |
| 300 | 80.8 | 6 | 0.0200 | 0.0054 | 3.71 | 3.71 |
The expansion rate dθ/dt is:

where
W= object width (feet)
D = distance (feet)
V = closing velocity in (feet/sec)
From this formula, it is apparent that the expansion rate grows with increased size and closing speed, but declines with distance2. Note that the distance variable is squared, making it the most important factor. Figure 2 also illustrates the importance of the distance variable. The most salient aspect of the figure is that expansion rate is low when the distance between the driver and the lead vehicle is large. As the driver approaches, the rate grows slowly at first but then explodes at short distances. Perceptually, expansion goes from undetectable to highly obvious within a short and dramatic transition period. In contrast, speed and size are less critical.
In the analysis of a specific collision, the important factor is the position on the curve, the distance where the looming is perceptible. At longer distances, the driver cannot see the looming and cannot accurately judge the time-to-collision3. Once the driver reaches a distance where the looming is perceptible, then he theoretically can perceive the TTC. Whether this tells him to respond immediately is a different question that I discuss later. But it is certain that until looming is perceptible, the driver has no accurate information about TTC.
The distance at which looming is detectable (the point of the curves in Figure 2) depends on the motion threshold, the minimum rate of expansion that is perceptible. This motion rate is usually expressed as angular velocity, degrees/second or more often as radians/second. Estimates range from 0.0030 radian/second in highly optimized research experiments (e.g., Hoffman & Mortimer, 1996) to 0.0275 radian/second (Plotkin, 1984) based on road accident data. There are reasons to discount both of these extreme values and to put a reasonable motion threshold range estimate for normal drivers under good daylight conditions at about 0.004 to 0.008 radian/second (Green, 2024). However, it should be remembered that these thresholds come from "car following" studies where a driver trails another vehicle and responds when the lead vehicle brakes. There are absolutely no studies of looming that involve drivers traveling at high speed on a freeway when they encounter stopped or slow moving vehicle.
Table 2 shows distance and time-to-collision (TTC) at which looming is perceptible as a function of looming threshold for a driver traveling 60 mph (88.02 ft/sec). I have assumed that width is 8 feet, the width of a typical tractor-trailer.
Table 2 Looming threshold, distance of looming perceptibility and TTC. Assumed speed is 60 mph, and lead vehicle is assumed 8 feet wide.
| Threshold (rad/sec) | Distance (feet) | TTC (seconds) |
|---|---|---|
| 0.003 | 484.48 | 5.50 |
| 0.004 | 419.57 | 4.77 |
| 0.005 | 375.28 | 4.26 |
| 0.006 | 342.58 | 3.89 |
| 0.007 | 317.71 | 3.60 |
| 0.008 | 296.68 | 3.37 |
| 0.009 | 279.71 | 3.18 |
The table shows that the driver has from 3.37 to 4.77 seconds to avoid collision. This range is valid for perfect conditions. The driver must be looking directly at the lead vehicle's center under good visibility. Low contrasts are known to raise motion thresholds, so dim light, fog, etc. can shorten the looming distances. Moreover, all threshold data apply only to "local 𝜏, Type 2," the dilation of a single object such as a vehicle's rear. There are almost no data for "local 𝜏, Type 1," the spread of points on the object. For example, as a driver approaches a vehicle that has only taillights visible, the lights will spread, providing a looming cue. There are reasons to believe that threshold for this Type 1 looming will be higher. See (Green, 2024) for more explanation.
Lastly, Table 2 does not take into account driver perception-response time (PRT) or the time required to depress the brake pedal. For example, a 1.5 seconds PRT and 0.4 second pedal depression time subtracts 1.9 seconds and 167 feet from the table.
What Does It All Mean?
Many analyses assume that a normal driver would and should respond as soon as looming is perceptible. Is that a good assumption? There are several reasons why it probably is not.
- All the thresholds for looming originate from car-following paradigms, where the lead vehicle is a relatively short distance away in daylight, the speed is slow, and the deceleration occurs suddenly. It is unclear whether these thresholds generalize to the case of a freeway driver traveling 70 mph at night who encounters a stopped truck. The speeds are higher, the distances are greater, the approach speed is greater, and yet the growth of looming is slower and more gradual, at least at first. The distance is an especially critical variable since drivers rely on different information at short and long distances (e.g., DeLucia, 2008). Output from the primary visual cortex splits into ventral and dorsal streams (e.g., Milner & Goodale, 1995). The ventral stream is the "what" system that is responsible for conscious object recognition. It uses spatial information and operates at long distances. It crudely infers relative motion from change in location. The dorsal stream is the where ambient "where" system that operates outside of consciousness and guides egomotion using optical information. It directly perceives absolute motion from optic flow. On a freeway, the looming of a stopped vehicle generally becomes available beyond "action space" (Cutting & Vishton, 1995), roughly the border between where ventral and dorsal system operate. The short distance car following data from the dorsal system may not predict driver behavior at the vista/action border.
- Many people mistaken believe that looming specifies closing rate. It does not. It is not a "specifying variable"—an infinite number of closing speeds, distances and lead vehicle sizes can produce the same angular velocity. Many people also mistakenly believe that it can reveal whether a lead vehicle is stopped. It can't. In addition to not being a specifying variable, it depends entirely on relative speed, not absolute speed. A 60 mph driver approaching a 20 mph lead vehicle sees the same looming as a 40 mph driver approaching a stopped vehicle.
- Looming can combine with visual angle to reveal the TTC, but it still does not specifically say whether response is necessary. The driver still must interpret the TTC in terms of the overall situation. For example, drivers brake at longer TTC at higher speeds (Host, 1990), although not long enough to compensate for the increased stopping distance. Moreover, drivers commonly travel behind a lead vehicle with a 1.5 seconds or less temporal headway (Taieb-Maimon, & Shinar, 2001), which is just the instantaneous TTC. They do this because they do not expect the lead vehicle to suddenly brake hard. There is more to deciding whether to brake than merely perceiving the TTC. Moreover, our brains evolved prior to the development of motorized vehicles. At foot speed, an object even 150-200 feet away is not an immediate threat. We don't have a strong innate sense that an object at that distance constitutes a collision affordance.
- The entire scenario described above is based on the "𝜏 hypothesis," which posits that drivers use 𝜏 to judge TTC and to avoid collision. However, much research (e.g., Bootsma & Craig, 2003) challenges the hypothesis. While drivers certainly incorporate optical image growth into judgments about when to brake, the judgment is not necessarily based on 𝜏 either alone or with other variables. A common finding is that braking behavior is better predicted by a weighted combination of expansion rate and image size. Other research suggests that drivers use the temporal derivative of 𝜏,
 ("tau dot"), rather than 𝜏 or perhaps use the temporal derivative of the expansion rate. All of these optical variables change systematically with TTC.
 - Many treat looming as a signal to respond, i.e., that's when the reaction time clock starts running. It is not. Recent research (Markkula, Engström, Lodin, Bärgman, & Victor, 2016) has investigated driver response to looming in naturalistic studies, where they can travel freely in an instrumented car. The data show that drivers do not reliably respond to looming until it reaches 0.02 rad/sec, which is much higher than the psychophysical motion perception threshold described above. The drivers then respond in under a second. The implication is clear: drivers respond to perceived hazards and not simply to motion. They must interpret the motion, so there is a gap between simple perception of motion and perception of a hazard that signals the need to respond.
- There is good evidence that driver TTC judgments are also influenced by spatial variables such as depth and distance cues, e .g., size, linear perspective, occlusion, height in the visual field, etc. Viewers also experience "velocitation" (motion adaptation), which causes the apparent looming to slow. (See Green, 2024 for more discussion).
This last point deserves some amplification. Once the driver discovers that he has 4 seconds to avoid a collision while traveling at 60 mph, he must decide what to do. His actions depend on several factors. First, he must know the stopping capability of his vehicle. How much distance does he require to stop? Unfortunately, the driver has likely never had to slam on the brakes while traveling at 60 mph, so he has no direct experience. In fact, few drivers ever exceed .5g braking, about 2/3 of the maximum normally achievable, under any circumstances. The driver is likely faced with a situation that he has never encountered before, so he has no learned response or even mental schema or script to cover the situation.
Driver response partly depends on their perception of "action boundaries", the point that separates possible from impossible actions. The driver must respond before reaching that point, but how does he know where it lies? The answer depends on an understanding of braking capabilities, which in turn depends on an understanding of basic physics. If he has hit the brakes hard in the past, it was probably at a low speed. However, stopping distance increases with the square of speed. That is, braking at 60 mph requires 4 times the distance of braking at 30 mph. Since people tend to extrapolate linearly (stopping distance at 60 mph should be twice that at 30 mph), the driver is likely to underestimate the stopping distance. The underestimation will likely be even greater if traveling downhill or on wet or icy roads, both conditions that reduce tire friction.
Moreover, collision avoidance is not the driver's only immediate problem. Drivers do not want to make extreme responses while traveling at high speed. A sudden hard brake or steer risks loss of control, leaving him in a ditch, colliding with some roadside object, crashing head-on into oncoming traffic, rolling over, etc. The driver will likely want to gather more information and increase certainty before deciding on such an extreme action. Gathering information, however, requires time, which shortens the available stopping distance. Alternatively, the driver may temporize by taking his foot off the accelerator or by lightly stepping on the brake. The result is a tradeoff of uncertain value. It slows the vehicle and buys time at the cost of distance. It may or may not be helpful, depending on the degree of slowing and the length of time required to assess the situation.
Lastly, the driver may simply have no feasible response. This scenario occurs most often when there is a tractor-trailer blocking all lanes of the roadway. The driver is faced with an avoidance-avoidance conflict (Lewin, 1935), where the response alternatives are all unfavorable. In such cases, PRT is often very long. "Should I steer right into the ditch or left into oncoming traffic?" It's like asking your child whether he'd prefer broccoli or spinach for dinner. Expect a very long pause.
A Realistic Scenario
A recent collision between a car and a stopped tractor-tanker truck demonstrates a more realistic relationship between looming and driver behavior. The driver was traveling between 60 and 65 mph stated that he saw the tractor-tanker about 12 seconds before collision, but perceived it as moving at normal speed. He noticed a "problem" four-five seconds before collision then realized that he was in an emergency situation about three seconds prior to collision.
Table 3 shows how these observations and times match with angular velocity values. (For simplicity, I have assumed a speed of 62.5 mph, the mean of his estimates).
Table 3. Angular velocities, TTC and distance for three different percepts.
| TTC (seconds) | Distance (feet) | Looming (rad/sec) |
|---|---|---|
| 12.0 | 1100 | 0.0006 |
| 4.5 | 413 | 0.0043 |
| 3.0 | 275 | 0.0097 |
At 12 seconds prior to collision, the angular velocity is far too low to perceived looming, which is why the tractor-tanker appears to be moving at normal speed. By a TTC of 4.5 seconds, he is just reaching the distance 0.004 rad/sec limit where the angular velocity is approaching perceptibility. At three seconds, the looming is highly perceptible at 0.0097 rad/sec and the imminent collision is obvious. In sum, perception of looming is not a sudden, all or none. It grows gradually as distance decreases and angular velocity increases.
Not long ago, I experienced this same gap between sensing a danger and identifying its source. I was traveling down Toronto’s Don Valley Parkway at about 90 kph in free flowing traffic. I suddenly noticed something odd about the car ahead. An alarm bell went off somewhere in my brain, but I couldn’t quite identify what was happening for a moment. Traffic was light, and I saw no other information that would indicate the need to slow. Then I realized that I was approaching the lead vehicle at a high rate and that hard braking was necessary. I was so focused on the lead vehicle that the prospect of changing lanes never entered my mind. Perceptual narrowing under the stress had concentrated attention on a single, simple object and response. As with the driver in the highway scenario described above, looming per se was not the cue for braking. It only produced some vague alarm signal. Despite 58 years of driving and spending much of my time analyzing other drivers’ roadway collisions, I still cannot say exactly what caused me to finally realize that I was in an emergency. As Markkula, Engström, Lodin, Bärgman, & Victor (2016) discovered in their study, moreover, brake lights were not a factor in avoidance responding. The vehicle must have had its brake lights illuminated to decelerate so rapidly, but perceptual narrowing had me focused intently on the car itself trying to understand what was happening. I don’t remember ever consciously seeing the brake lights. This incident happened in daylight. At night, the brake lights might have been more salient.
Thinking back, I recall the impression of eventually realizing that the lead vehicle was growing in size at an alarming rate. Perhaps I was responding to image dilation rate τ-1 or to angular acceleration, the temporal derivative of the looming—an optical variable that has received almost no attention. Of course, unconscious processes control much of driving, so this impression is speculation, and I can’t be sure what made me trigger or modulate braking. I am sure that I never consciously thought anything about distance or TTC, or the fact that the road had a steep downgrade, so I would have to brake harder than normal to decelerate sufficiently. Whatever was happening, much of it was out of my conscious awareness, possibly because the dorsal-ambient system was in control. Several studies (e.g., Terry, Charlton, & Perrone, 2008; Nilsson, Aust, Engström, Svanberg, & Lindén, 2018) suggest that looming/τ-1 is perceived automatically and is unaffected by conscious cognition. This still doesn’t explain the initial confusion experienced. There was an emotional arousal that goes beyond an objective numerical analysis for factors such as TTC, speed, looming rate, etc. Possible explanations for the arousal are discussed below.
My experience, as well as that of the highway driver, further highlight the artificiality and limitations of controlled research studies. The shock of being in a sudden emergency plays a crucial role in behavior by creating confusion and intense perceptual narrowing. (I now understand the finding that drivers frequently fail to swerve even though it may be the best chance for avoidance.) Road research does not put drivers in real emergencies and simulator research creates only fake ones. The drivers don’t feel the proverbial “icy finger” that sets off all the alarm bells. They don’t have the gut feeling of speed that comes from the vestibular feedback of normal driving. Simulator data may be useful for investigating ordinary driving, but they likely say little about behavior in real emergencies. Moreover, the drivers are tested repeatedly in the same situation so they learn to adapt and know what to expect. I didn’t have such a luxury on the Don Valley Parkway that day.
In sum, the typical rear-end collision with a stopped/slow vehicle on the freeway probably goes something like this:
1. The driver perceives that he is closing on a vehicle relatively far ahead using headway or other spatial information, which is sufficient to perceive the sign of relative motion, closing, falling behind or remaining constant, but says nothing about the rate of closing. He recognizes a situation that he has seen many times and assumes that it is moving a normal freeway speed. He is in operating from "habit" (Trick, Enns, Mills & Vavrik. 2004) controlling the vehicle but with little conscious awareness. Since he knows his vehicle can brake or swerve long before overtaking, there is no need to respond or even to pay particular close attention until he is much closer to the action boundary. This scenario normally works fine, since he overtakes the lead vehicle only very gradually. He doesn't need highly detailed TTC/urgency information;
2. If the lead vehicle is stopped or very slow moving, then the situation changes at an intermediate distance, perhaps 250-400 feet. He reaches the looming perception distance and begins to notice that something is happening, possibly because the ambient/dorsal system operates outside of awareness (unless you are in an experiment and have been directed to attend it.) The angular velocity and impression of looming is not yet strong, and the driver tries to figure out what is different. He gathers more information while time and distance are reduced (cf., Markkula, Engström, Lodin, Bärgman, & Victor, 2016). He does not initially realize that it is an emergency since he believes that he can slow in time. (Changing lanes at this point would require looking in the mirror, but he doesn't want to take his eyes off the road.) However, he has never had to brake hard at such a high speed before, and does not know physics, i.e., that stopping distance increases with the square of speed. He greatly underestimates the required stopping distance, so he hesitates until he can assess the situation further, especially if he is a cautious driver (Prynne & Martin, 1995); and
3. He reaches a point where the looming is strong, and the impression of imminent collision is clear because the angular velocity is increasing at a high rate. By this point, however, he may have come too close to the lead vehicle to avoid.
In sum, there are two looming thresholds. The first is the psychophysical motion threshold, which is what the car-following controlled research studies measure. These typically show a 0.003 rad/sec threshold. Adapting them to the real world requires a higher value, of perhaps 0.004 to 0.008 rad/sec. However, studies that used real-world crash data (e.g., Plotkin, 1984; Maddox & Kiefer, 2012) and naturalistic data (Markkula, Engström, Lodin, Bärgman, & Victor, 2016) have found much higher thresholds. This second threshold might be termed the "hazard threshold", which reflects the driver recognition that a response is necessary. Dual thresholds for simple detection vs. recognition are not unusual in other domains. In contrast perception, for example, recognition thresholds are typically much higher than simple detection thresholds (Green, 2024).
Conclusion
Drivers likely rely heavily on optical information, such as dθ/dt and 𝜏 in judging when to brake. However, calculation of the looming perception distance is only the starting point in analyzing driver behavior. First, drivers incorporate other sensory information in making their judgments about whether to act. Although I have not discussed them here variables, such as edge rates, global optic flow rates, contrast level, motion adaptation and depth cues may play a role (Green, 2024). Second, the sensory information is only grist for the cognitive mill—the driver must interpret the information based largely on experience and expectation. The presence of a stopped vehicle on a freeway is a rare and unexpected event. Studies of accident rates and speed differential suggest that such vehicles constitute an "error trap" (Reason, 2004) that is likely to snare many drivers.
Footnotes
1Tau actually give a very close approximation rather than the precise TTC because it relies on the small angle approximation.
2While this article discusses looming, there is another optical variable 1/𝜏 (inverse tau) that is closely related. Several research studies suggest that drivers use 1/𝜏 rather than looming to guide response. For present purposes, the distinction is not important. First, both are highly nonlinear and change from very low to very high values in a short time/distance span. Both also contrast with 𝜏 which is a linear function of time/distance. Second, looming is a component of 1/𝜏, so they have the same threshold. Third, there is no evidence of a critical value for 1/𝜏 that triggers driver response. In contrast, some studies suggest looming values for driver response, although the estimates vary by a factor of ten. See above and (Green, 2024).
3People (myself included) sometimes speak loosely about" closing rate". This is a mistake, as tau provides information about instantaneous time-to-collision and says nothing about closing rate. Tau dot, however, is an indicator of "closing rate".
References
Bootsma, R., & Craig, C. (2003). Information used in detecting upcoming collision. Perception, 32, 525-544.
Gibson, J. J. (1979). The ecological approach to visual perception. Boston: Houghton Mifflin.
Green, M. (2017). Roadway Human Factors: From Science To Application. Tucson: Lawyers And Judges Publishing.
Green, M. (2009). Perception-reaction time: Is Olson (& Sivak) all you need to know? Collision, 4, 88-93.
Hoffman, E., & Mortimer, R. (1996). Scaling of relative velocity between vehicles. Accident Prevention and Analysis, 28, 415-421.
Lee, D. 1976. A theory of visual control of braking based on information about time-to-collision. Perception, 5, 437-459.
Lewin, K. (1935). A dynamic theory of personality. New York: McGraw-Hill.
Maddox, M. E., & Kiefer, A. (2012). Looming threshold limits and their use in forensic practice. Proceedings of the Human Factors and Ergonomics Society Annual Meeting, 56, 700-704.
Markkula, G., Engström, J., Lodin, J., Bärgman, J., & Victor, T. (2016). A farewell to brake reaction times? Kinematics-dependent brake response in naturalistic rear-end emergencies. Accident Analysis & Prevention, 95, 209-226.
Plotkin, S. (1984). Multiple Causation. Automotive Engineering and Litigation, 1, 215-228. New York: Garland Law Publishing.
Reason J. (2004) Beyond the organisational accident: the need for "error wisdom" on the frontline. Quality And Safety In Health Care, 13 Suppl 2: ii28-ii33.
Simon, H. A. (1956). Rational choice and the structure of the environment. Psychological Review, 63, 129-138.
Taieb-Maimon, M. & Shinar, D. (2001). Minimum and comfortable driving headways: Reality versus perception. Human Factors, 43, 159-172.
Weinberger, H. (1971). Conjecture on the visual estimation of relative radial motion. Nature 229, 562-562.
Related
- A Crash Course In Collisions: The CBDR Rule
- Is The Moth-Effect Real?
- Accident Statistics on Driver Error: The 94% Myth
- Human Error in Road Accidents
- Which drivers are safest? You're in for a Surprise
- Weather and Accidents: Rain & Fog
- Accidents At Rail-Highway Crossings
- Underride Accidents
- Cell Phone Distraction: A Cautionary Tale
- Understanding Human "Error": Fault Tolerance, Practical Drift And Traps
A division of 2057949 Ontario, Inc.
Copyright © 2024 Marc Green, Ph. D.
Home Page
Contact Us
![]()
![]()
![]()
![]()
![]()
![]()
![]()